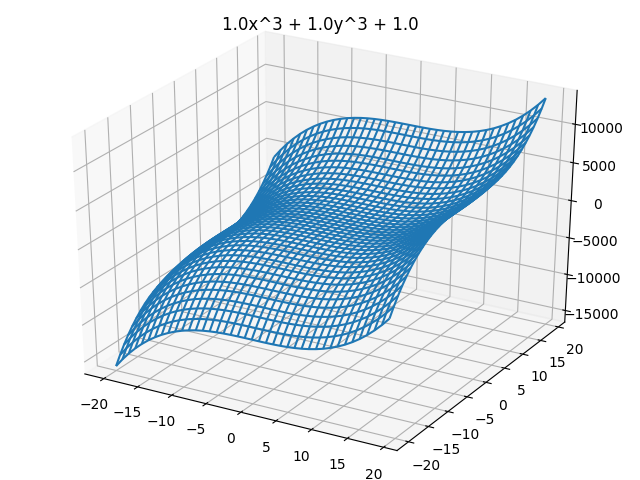
 [Axes3D]曲面の3Dグラフ
2018/12/04
Axes3D を利用して、曲面を3Dグラフ化する 曲面の関数
描画はワイヤーフレーム plot_wireframe() を利用した。
<
div>

from mpl_toolkits.mplot3d import Axes3D
import matplotlib.pyplot as plt
import numpy as np
import sys

def calculateMesh(min_value, max_value, step):
    MESH_COUNT = 20
    x = np.arange(min_value, max_value, step)
    y = np.arange(min_value, max_value, step)
    xx, yy = np.meshgrid(np.linspace(x.min(), x.max(), MESH_COUNT), np.linspace(y.min(), y.max(), MESH_COUNT))
    return xx, yy

def plane(x, y, n, a, b, c):
    z = a*x**n + b*y**n + c
    return z

print('Graph: ax^n + bx^n + c')
step = 1
n = int(input('Please input n'))
if (n <= 0): sys.exit('invalid n!')

a, b, c = map(float, input('Please input a, b, c').split())
min_value, max_value = map(float, input('Please input min, max').split())
if (min_value >= max_value): sys.exit('invalid min, max!')

xx, yy = calculateMesh(min_value, max_value, step)
zz = plane(xx, yy, n, a, b, c)

fig = plt.figure()
ax = fig.gca(projection='3d')
ax = Axes3D(fig)
ax.plot_wireframe(xx, yy, zz)
plt.title("%sx^%s + %sy^%s + %s" % (a, n, b, n, c))
plt.show()