 2次関数のグラフと解を強引にグラフ化
2018/12/02
2次関数の解はSympy.solve, scipy.optimize.fsolve を使っても求められるが、ここでは非効率だが2次関数の一般式を作成、解を求めてグラフ化してみる。
2次関数の定数を標準入力
a, b, c = map(float, input('Please input a, b, c ').split())
*Python3 の記述
解の公式
def answer(a, b, c):
    x1 = (-b + np.sqrt((b ** 2) - (4 * a * c))) / (2 * a)
    x2 = (-b - np.sqrt((b ** 2) - (4 * a * c))) / (2 * a)
    return [x1, x2]
判別式
解がない(虚数)だと、プロットできないので判別式の関数を作成
((b**2) - (4 * a * c)) >= 0
X座標の配列
最大値、最小値、X軸プロット間隔を設定
def plotX(a, b, c):
    max_x = 10
    min_x = -10
    x = np.arange(min_x, max_x, 0.1)
    return x
*最終的に最大値、最小値は、解によって動的に変化させる
Y座標の配列
二次方程式を記述
def plotY(a, b, c):
    return a*x**2 + b*x + c
サンプル
import matplotlib.pyplot as plt
import numpy as np
from sympy import *
def hasAnswer(a, b, c):
return ((b * b) - (4 * a * c)) >= 0
def answer(a, b, c):
x1 = (-b + sqrt((b ** 2) - (4 * a * c))) / (2 * a)
x2 = (-b - sqrt((b ** 2) - (4 * a * c))) / (2 * a)
return [x1, x2]
def plotX(a, b, c):
max_x = 10
min_x = -10
if (hasAnswer(a, b, c)):
x = answer(a, b, c)
x1 = x[0]
x2 = x[1]
center = (x2 - x1) * 0.5
band = abs(x2 - x1)
if band <= 1:
band = 10
max_x = round(x1 + band, 0)
min_x = round(x2 - band, 0)
x = np.arange(min_x, max_x, 0.1)
return x
def plotY(a, b, c):
return a*x**2 + b*x + c
def plotScatterX(plt, a, b, c):
if (hasAnswer(a, b, c)):
x = answer(a, b, c)
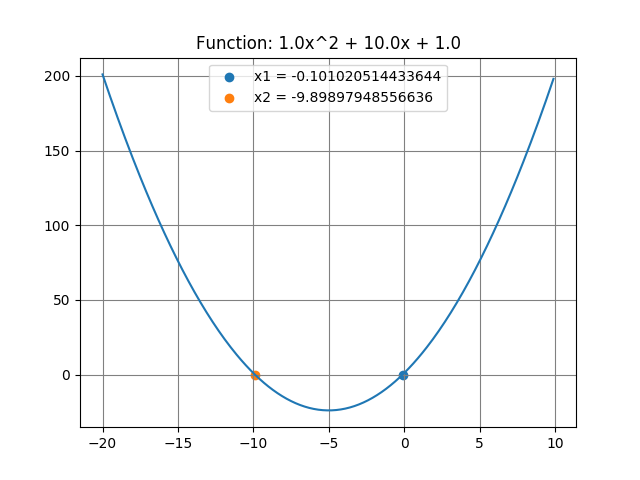
plt.scatter([x[0]], [0], label = 'x1 = %s' % x[0])
plt.scatter([x[1]], [0], label = 'x2 = %s' % x[1])
return
print('Simulatenous Equations. a * x^2 + b * x + c')
a, b, c = map(float, input('Please input a, b, c').split())
x = plotX(a, b, c)
y = plotY(a, b, c)
plt.plot(x, y)
plotScatterX(plt, a, b, c)
plt.title('Function: %sx^2 + %sx + %s' % (a, b, c))
plt.grid(color='gray')
plt.legend()
plt.show()